

Where it lives and who can open it
Org Brain is the Org Brain item in the organization settings rail, at/organization/settings/knowledge-graph. Like the rest of organization settings, the route is owner and admin only; a member who types the URL is bounced out of settings and lands back in the app at /chat.
The aggregation behind the page is deliberately readable by any organization member: it is built to answer “how is this organization using Receipt?” and returns no per-user attribution, no raw receipts and no run contents. The route guard is stricter than that, so in this release only owners and admins reach the page.
Updated {time} · refreshes automatically. The refresh is a 30-second poll, not a live push; the previous window’s numbers stay on screen while the next poll resolves, so the page never blanks. Before any data arrives you see “Loading organization activity…”, and with nothing recorded, “No activity to show yet.”
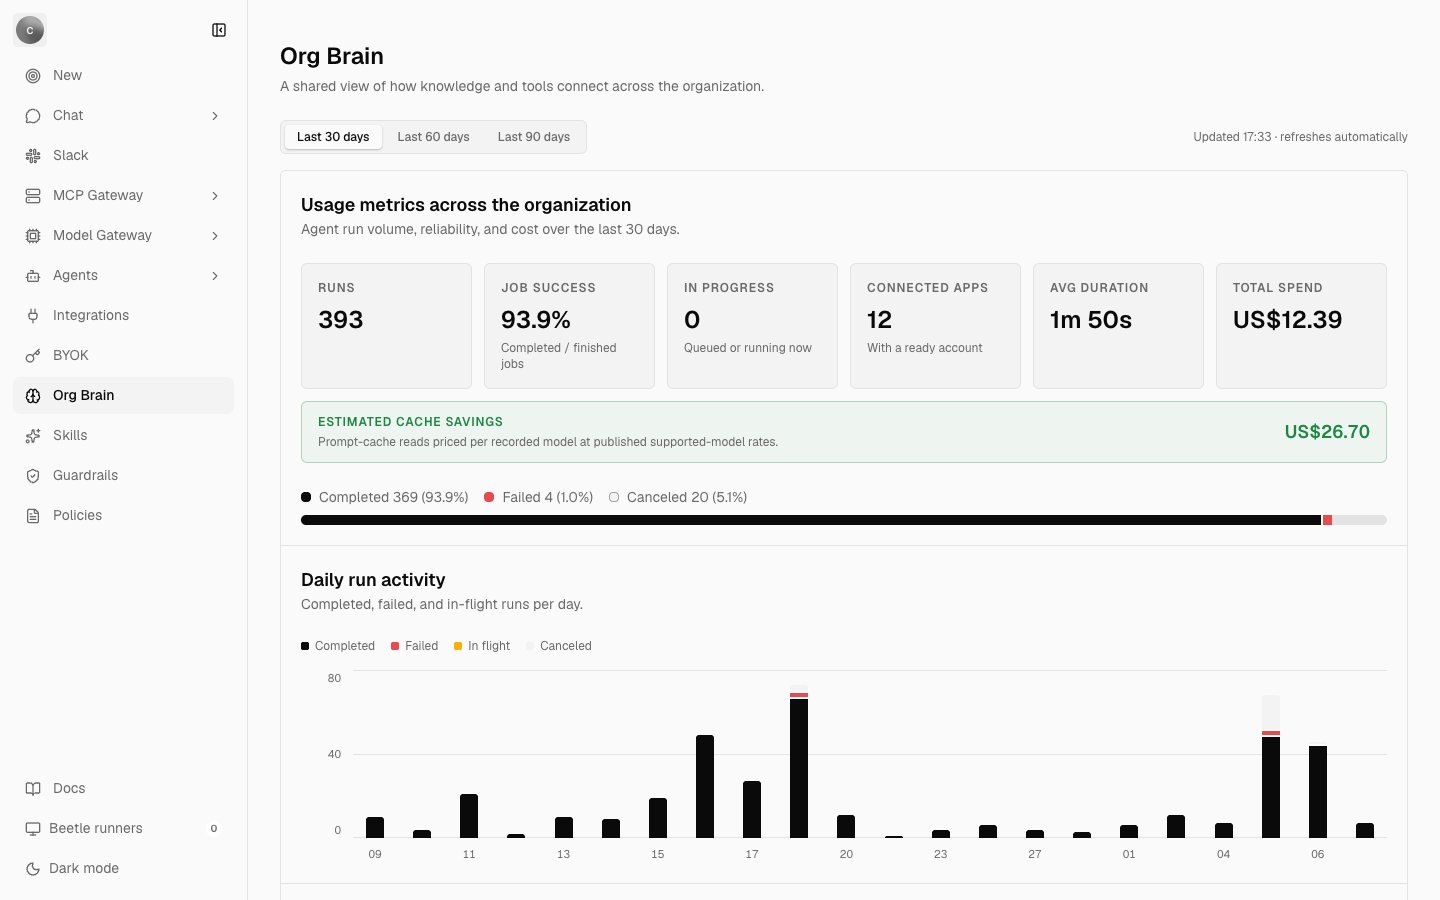
Org Brain over the last 30 days. Notice the freshness line on the right — 'refreshes automatically' is a 30-second poll — and the six headline tiles above the estimated cache savings band and the completed / failed / canceled outcome bar.
What the tiles count
The first card is “Usage metrics across the organization”, described asAgent run volume, reliability, and cost over the last {n} days. An objective is the goal you handed Receipt; a job is one queued unit of work behind it, so a single objective usually produces several jobs (objectives and tasks defines the whole vocabulary). These six tiles are counted from job records, not from objectives:
A run in flight has no outcome yet, so Job success counts only jobs that finished. Connected apps is current state rather than windowed activity — it does not shrink when a window shortens.
Where Org Brain has no measurement for a value it renders Not recorded, never a zero, so an unmeasured quantity is never mistaken for a genuinely empty one. This applies to Job success, Avg duration and Total spend. The cache savings estimate works differently: when nothing could be priced, the band is not drawn at all.
Completed {n} ({x}%), Failed {n} ({x}%) and, when any exist, Canceled {n} ({x}%). The next card, “Daily run activity” — “Completed, failed, and in-flight runs per day.” — plots the same jobs bucketed by UTC calendar day.
Which applications your objectives used
“Application usage across the organization” shows the “Share of organization objectives that used each application, plus connection readiness.” Each row is one application, and it merges two independent facts:- Usage comes from each objective’s execution contract — the capability list the run was actually authorized under — counted as distinct objectives per provider so a multi-task objective cannot inflate its own application. The row ends with
{n} objectives · {x}%. - Readiness comes from your saved connections, as
{valid} of {n} accounts readyor No saved account, with a state word of Connected, Needs attention or Not currently connected. Where saved connections are invalid or expired, a line reads{n} saved connections need attention; otherwise the row showsLast checked {time}.
View all {n} when there are more. With nothing to show: “No connected applications or application activity to show yet.”
The cloud connections the Agent Registry uses for discovery are counted here too. Readiness is grouped by provider with no filter on the connection’s name, so an AWS, Azure or Google Cloud connection created for scanning raises Connected apps and appears as an application row — even though the organization Integrations page deliberately hides those same connections.
Recent objectives
The last card, “Objectives”, is described as “The most recent completed, failed, and blocked objectives. Filter by status to narrow the list.” Columns are # / Objective / Status / Recorded / Actions, with a Search objectives box, a status filter of All statuses / Completed / Failed / Blocked, and a count line reading{n} of {m} objectives.
The row title, or View details in the row menu, opens a dialog headed Completed objective, Failed objective or Blocked objective. It shows the objective request in full, and for anything that did not complete, a Failure message or Blocked message panel — or No failure message recorded. when nothing was captured.
For the full task list and live run state, use the monitoring surfaces in monitoring your runs. Call-level figures — per tool, per connector, per actor — are not in Org Brain; they live in gateway activity. Per-user model spend lives in usage and spend.
Organization knowledge
Organization knowledge is a separate surface at/organization/settings/knowledge. It appears in neither the settings rail nor the settings menu — it is reachable only by typing the URL. The page is headed “Organization Knowledge” and described as “Upload Markdown or PDF files for your organization’s knowledge base.”
It is documents, not analytics, and it is not Org Brain: Org Brain is a dashboard over run activity, and this is a store that app chat retrieves from. It is also not skills, which are instructions mounted into background runs.
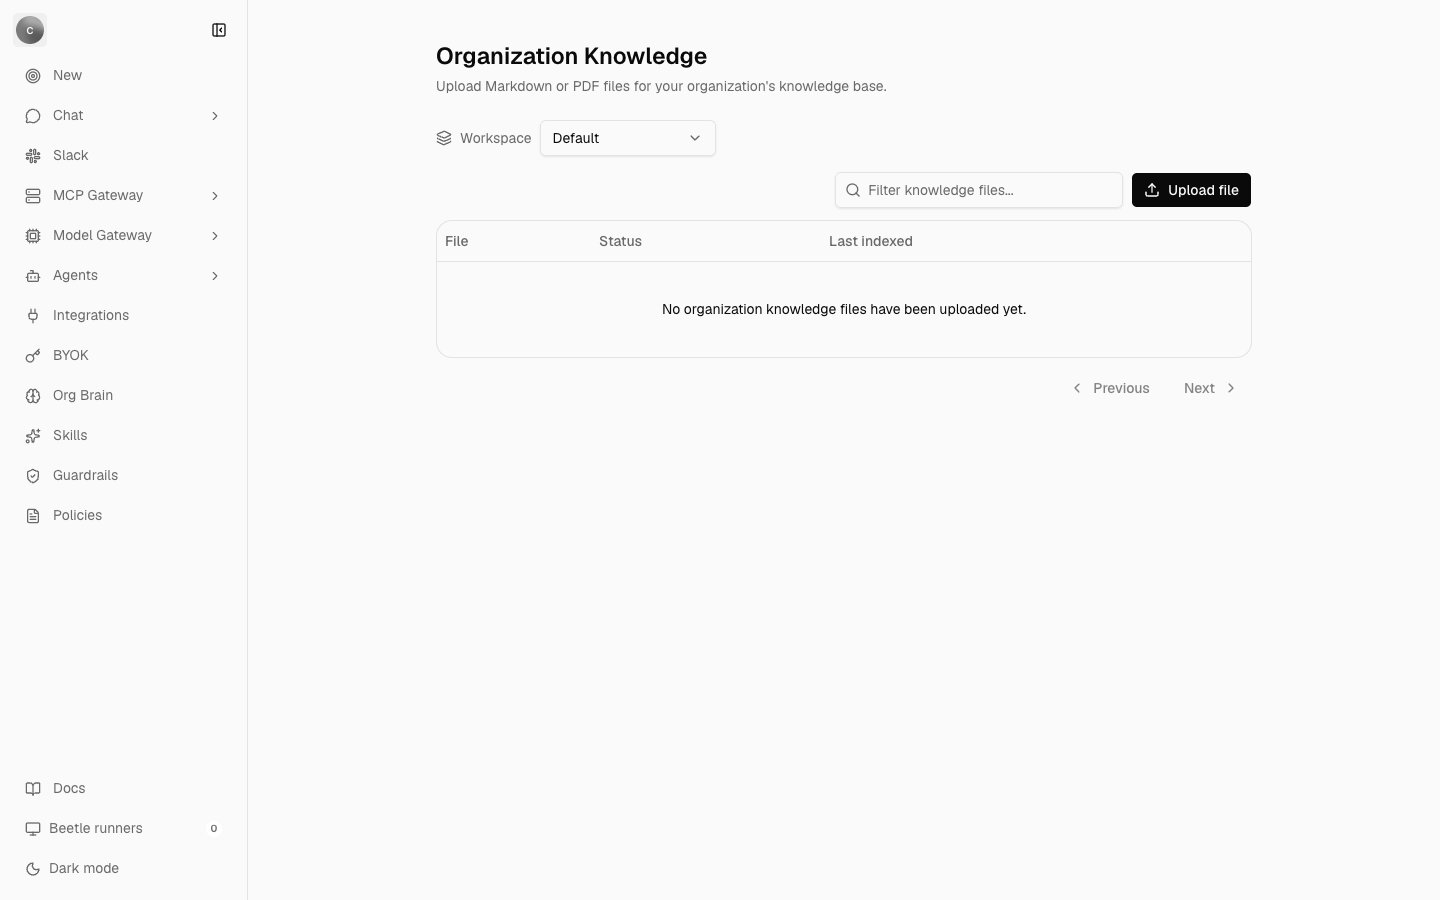
The Organization Knowledge page before anything is uploaded, showing the File / Status / Last indexed columns, the filter box, the Upload file action and the Previous / Next pager. The Workspace strip above the table is chrome every organization settings page carries; switching workspace there does not change this list, because knowledge files belong to the whole organization.
What you can upload
Knowledge accepts.pdf, .md and .markdown, up to 25 MB per file. The upload button is labelled Upload file; a Filter knowledge files… input narrows the list, and Previous / Next below the table page through it ten files at a time. Before anything is uploaded the table reads “No organization knowledge files have been uploaded yet.”; while it resolves, “Loading organization knowledge…”.
The file is checked in the browser before it is sent, so an unsupported or oversized file fails immediately with File type is not supported for markdown conversion, File is empty or File exceeds limit of 25MB. Only owners and admins can upload or change anything here; the server refuses anyone else with “Only organization owners or admins can manage org knowledge.”
That 25 MB ceiling applies only here. A file attached to a chat message is limited to 10 MB — a different limit for a different surface.
Status and indexing
Columns are File / Status / Last indexed, plus a row actions menu. Each file carries two independent states, shown as two badges in the Status column. Its activation state is Active or Inactive. Its index state is Indexed, Pending index or Index error; until a file has been indexed, the Last indexed column readsNot indexed yet. The row menu offers Activate or Deactivate, Retry index, and Delete.
When indexing fails you get a summarised reason rather than the underlying error, because raw errors can carry internal paths and backend details:
How retrieval is switched on
There is no toggle for organization knowledge anywhere in the application, and a newly uploaded file starts Inactive. Activating at least one indexed file flips the organization’s knowledge flag to true, and that flag is what gates retrieval into chat prompts. Deactivating everything drops the active count back to zero and the flag with it. Retrieval considers only files that are active, indexed and still present, and it runs on app chat turns — background runs get their shared material from skills instead. Organization knowledge also depends on the embedding stack being available in the deployment. Embedding is on unlessVITE_ENABLE_EMBEDDING turns it off, and a vector store must be configured through QDRANT_URL and reachable. Without one, indexing reports Vector indexing is not configured and nothing is retrievable. See configuration.
Next step: go back to what the Catalog holds.