> ## Documentation Index
> Fetch the complete documentation index at: https://docs.kentron.ai/llms.txt
> Use this file to discover all available pages before exploring further.
# Gateway activity
> Read one workspace's tool traffic on its Gateway activity dashboard, and know which calls reach it and which never will.
Every MCP Gateway workspace has a **Gateway activity** dashboard of its own: how many tool calls ran in the last day, week or month, how many succeeded, how long they took, which actors made them, and every individual call with its status and duration. A second, smaller **Activity** page in the same workspace covers a different subject — connection lifecycle events — and says so itself.
**Tool calls made through the MCP bridge are not yet recorded as receipts, so they never reach this dashboard.** `POST /connect/mcp` — the endpoint behind `receipt mcp serve`, and behind `receipt tools call` without `--connection` — writes no `tool.called` or `tool.observed` receipt. Calls through `POST /connect/call` do: `receipt connect call` and `receipt tools call --connection`, including when a background run runs them inside its sandbox. A quiet dashboard beside a busy MCP client session is this gap, not a fault. See [the aggregate server](/mcp-gateway/aggregate-server).
## Where to find it
Open **MCP Gateway → Workspaces**, select a workspace, and choose **Dashboard** — the last entry in the workspace tab strip on its Overview, alongside Open integrations, LLM keys and Settings.
The workspace id sits in the path and the tab and range are search parameters, so a refresh, the back button or a link you paste to a colleague reopens the same view. Both parameters are optional and take a fixed set of values — `dashboard`, `users` or `team-usage` for the tab, `24h`, `7d` or `30d` for the range — and a link that leaves them off opens the Dashboard tab over the last 24 hours. There is no organization-wide version. The organization-level dashboard address redirects to the Workspaces page, because every figure here describes one workspace and a page with no workspace open could not say which.
Unlike the rest of organization settings, which is owner and admin only, the MCP Gateway pages are open to any member of the organization — and the workspace list only ever offers the workspaces you belong to. See [workspaces](/mcp-gateway/workspaces).
Above the tabs sit **Last updated** with the time of the last read (**Loading activity…** until the first one returns), a range selector whose menu offers **Last 24 hours**, **Last 7 days** and **Last 30 days** (closed, it shows the short form the URL carries — `24h`, `7d`, `30d`), and a **Refresh** button that refetches without changing the URL. Three page-level messages replace the tab content entirely:
| Message | What it means |
| ----------------------------------------------------- | ----------------------------------------------- |
| `Loading gateway activity…` | The first read for this range is still running. |
| `Gateway activity could not be loaded.` | The read failed. **Refresh** retries it. |
| `Sign in to an organization to see gateway activity.` | The session has no active organization. |
 ## The Dashboard tab
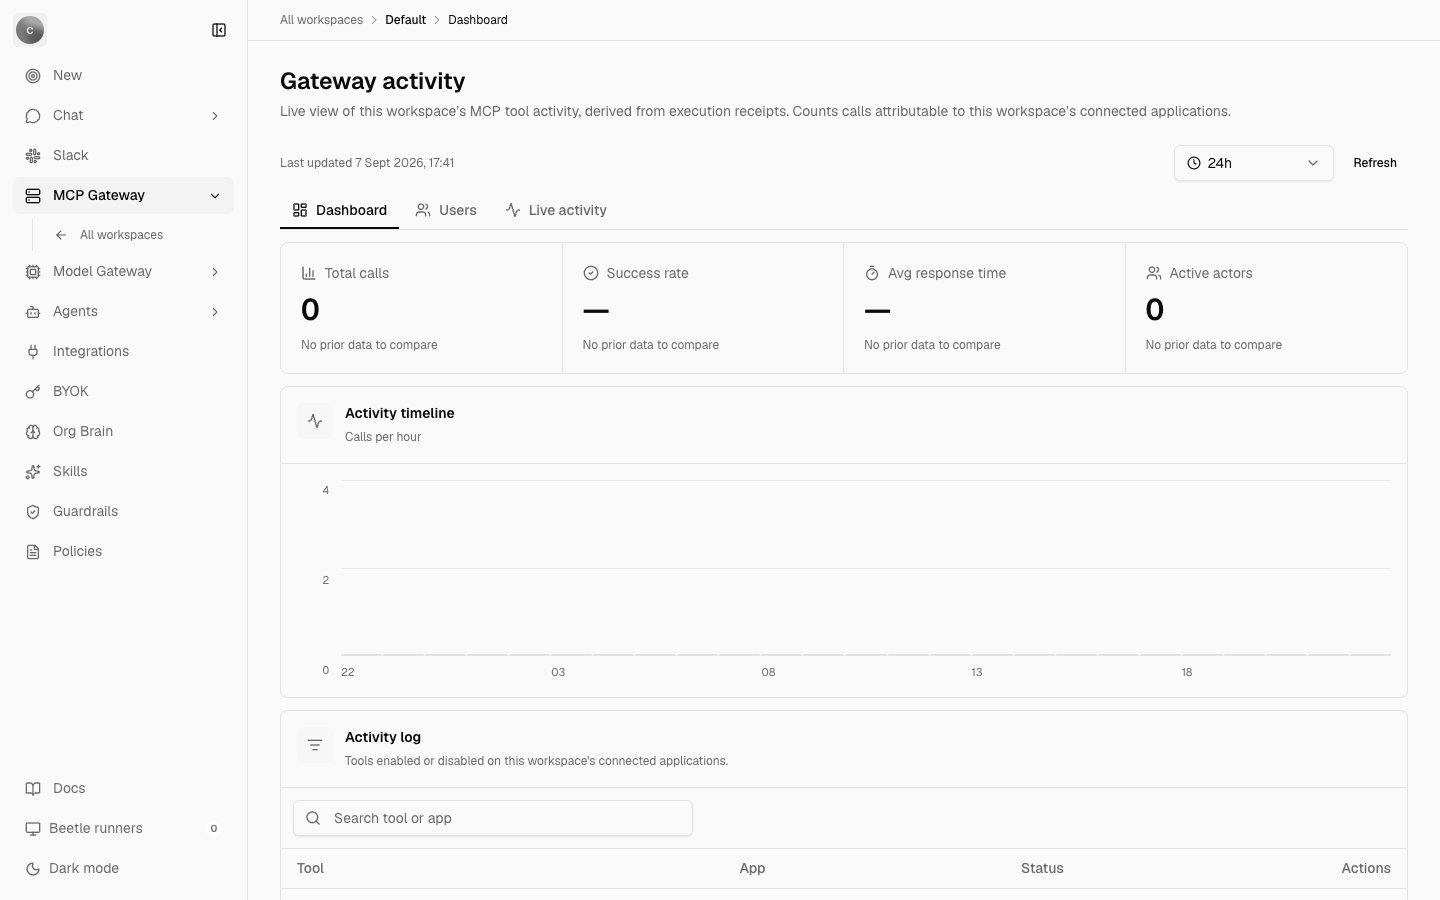
Four tiles summarise the window, each with a comparison against the immediately preceding window of the same length.
| Tile | What it counts |
| --------------------- | ------------------------------------------------------------------------------------------------------------------------------------------------------------------------------------- |
| **Total calls** | Tool calls attributed to this workspace inside the range. |
| **Success rate** | A percentage over settled calls only. Calls still in flight are excluded, and the tile shows an em dash rather than `0%` when nothing has settled — `0%` would read as total failure. |
| **Avg response time** | The mean duration across the calls that reported one. |
| **Active actors** | How many distinct actors made those calls. |
A delta line appears only when there is something truthful to say. When a metric is missing from either window — nothing settled, no call reported a duration — or when both windows are empty, the line reads **No prior data to compare** instead of a fabricated zero change. A rise from nothing is stated as a count rather than a percentage.
**Activity timeline** plots call volume as one bar per bucket: *Calls per hour* over 24 hours, *Calls per six hours* over 7 days, *Calls per day* over 30 days, which keeps the column count near 24–30 at every range. Every bucket in the window is drawn, including the empty ones, so a quiet period looks quiet rather than being compressed into a dense-looking cluster. A window with no traffic is therefore a flat chart, not a message: `No calls in this period.` appears only when the organization has no receipt log to read at all.
**Activity log** underneath is a different subject: "Tools enabled or disabled on this workspace's connected applications." It is the record of decisions about the gateway rather than traffic through it — a tool enabled or disabled, an integration connected or disconnected, a member invited or removed, a workspace created or removed. It follows the same window as the tiles, has a **Search tool or app** box, columns **Tool**, **App**, **Status** and **Actions**, a row menu carrying the full **Created** timestamp with its time zone, and shows at most 50 rows. Empty, it reads `No tool or integration changes recorded yet. Enabling a tool or connecting an integration will appear here.`; with a search that matches nothing, `No tool matches this search.`
## The Users tab
Three tiles — **Requests**, **Total tokens used** and **Total spend** — each sub-labelled **Across the organization**. They come from the organization's agent-run records rather than from gateway receipts: an MCP tool call consumes no tokens itself, the agent that decided to make it does. They follow the range you selected, but they never narrow to one workspace; for the spend figures themselves, and for what is recorded per model call, see [Usage and spend](/llm-gateway/usage-and-spend).
Below them is one row per actor, ranked by request count, with columns **User**, **Requests**, **Tools used** (distinct tools reached for, not a repeat of the request count), **Failed** and **Last seen**. Before anything has run it reads `No one has used this gateway yet. People and agents appear here once they make a request.`
An actor here is the agent id recorded on the receipt, not a person's account. Every gateway call carries the agent id `mcp-gateway`, whoever made it and from wherever — a background run's own calls included. The other id you may see is `orchestrator`: chat records handing an objective to Factory as the same receipt pair, so it lands on this page beside the gateway's own traffic. Read the column as *which agent*, and use the three tiles for organization totals.
## The Live activity tab
Every individual call in the loaded window, one per row. A **Search tool, connector, or actor…** box matches on the tool name, the actor and the connector; a status filter offers **All statuses**, **Succeeded**, **Failed** and **Running**; and a counter reads ` of calls`.
The columns are **Request**, **Connector**, **Status**, **Duration** and **Actions**. The request cell shows the resolved operation, falling back to the raw tool name, with the actor beneath it and the error text beneath that when the call failed. The connector cell shows an em dash when the tool resolved to no connection. The row menu holds **Created** and the full **Tool** name as the caller invoked it — search matches that name rather than the shortened operation in the cell. Rows are paged 25 at a time, adjustable to 10, 50 or 100.
Status is derived from the receipt pair rather than stored:
* **Succeeded** — a `tool.observed` receipt followed the call.
* **Failed** — the `tool.called` receipt carried an error, which settles the call immediately.
* **Running** — neither: a `tool.called` with no error and no observation yet.
Filtering happens over the window already in memory rather than by refetching, so a narrowed view can never disagree with the totals on the Dashboard tab. With filters applied and nothing matching, the table reads `No requests match these filters.`; with no filters and nothing recorded, `No gateway entries found. Agent activity will appear here as your team makes requests.`
## How the figures are derived
Each gateway call recorded through `/connect/call` writes a `tool.called` receipt and, when it succeeds, a `tool.observed` receipt, into a stream belonging to that workspace — carrying the tool name, the arguments it was called with, the duration and the workspace. The observation carries the first 2,000 characters of the result and marks itself truncated beyond that, so no full payload is copied into a receipt. A failed call gets only the `tool.called`, with its error.
Each load of the page reads up to 5,000 `tool.called` and 5,000 `tool.observed` receipts from the organization's streams and merges them in sequence order, so an observation is always processed after the call it belongs to. The selected window and the one before it come out of that same read, which is why the deltas cost nothing extra.
A call belongs to this workspace when its receipt recorded a matching workspace id. Receipts written before that field existed fall back to connector attribution: the tool name is resolved against this workspace's own valid connections through the `receipt___` and `____` forms, plus the `mcp____` convention MCP clients use. A name that resolves to no connected application cannot be assigned to a workspace, so it is left out of the workspace's figures rather than counted under every workspace.
Nothing is filled in with a placeholder: a metric that cannot be computed from a receipt renders as an em dash. Read the page as a picture of the tool calls that were recorded, not as a complete account of what an agent did — for that, open the run's [replay](/co-worker/replay).
## The workspace Activity page
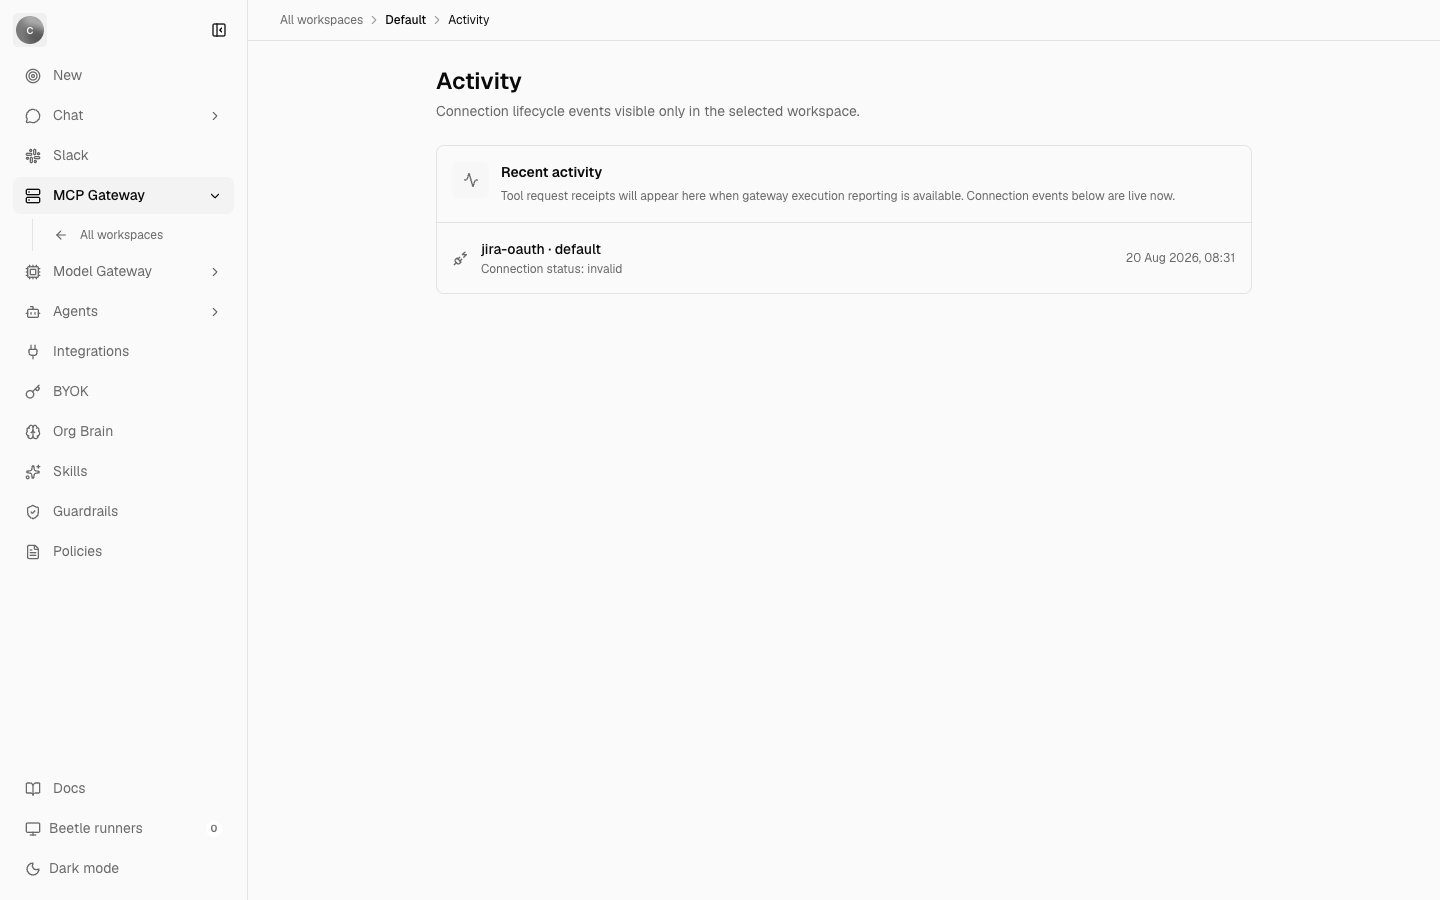
A separate, smaller page titled **Activity** describes itself as "Connection lifecycle events visible only in the selected workspace." It has no sidebar link; you reach it at the workspace's `…/activity` address, where the breadcrumb reads *Activity*.
It lists that workspace's connections, most recently changed first, each as `provider · name` with `Connection status: ` and the time it last changed. The list is the replicated connection table rather than receipts, so it reflects connecting, reauthorizing and disconnecting an app — an `invalid` status is the signal that a connection needs reconnecting. With no connections it reads `No activity in this workspace yet.`
**The Activity page shows no tool calls, and its own panel says so.** Under **Recent activity** it reads: "Tool request receipts will appear here when gateway execution reporting is available. Connection events below are live now." Until that changes, tool traffic lives on the Gateway activity dashboard above and this page is a connection log.
## The Dashboard tab
Four tiles summarise the window, each with a comparison against the immediately preceding window of the same length.
| Tile | What it counts |
| --------------------- | ------------------------------------------------------------------------------------------------------------------------------------------------------------------------------------- |
| **Total calls** | Tool calls attributed to this workspace inside the range. |
| **Success rate** | A percentage over settled calls only. Calls still in flight are excluded, and the tile shows an em dash rather than `0%` when nothing has settled — `0%` would read as total failure. |
| **Avg response time** | The mean duration across the calls that reported one. |
| **Active actors** | How many distinct actors made those calls. |
A delta line appears only when there is something truthful to say. When a metric is missing from either window — nothing settled, no call reported a duration — or when both windows are empty, the line reads **No prior data to compare** instead of a fabricated zero change. A rise from nothing is stated as a count rather than a percentage.
**Activity timeline** plots call volume as one bar per bucket: *Calls per hour* over 24 hours, *Calls per six hours* over 7 days, *Calls per day* over 30 days, which keeps the column count near 24–30 at every range. Every bucket in the window is drawn, including the empty ones, so a quiet period looks quiet rather than being compressed into a dense-looking cluster. A window with no traffic is therefore a flat chart, not a message: `No calls in this period.` appears only when the organization has no receipt log to read at all.
**Activity log** underneath is a different subject: "Tools enabled or disabled on this workspace's connected applications." It is the record of decisions about the gateway rather than traffic through it — a tool enabled or disabled, an integration connected or disconnected, a member invited or removed, a workspace created or removed. It follows the same window as the tiles, has a **Search tool or app** box, columns **Tool**, **App**, **Status** and **Actions**, a row menu carrying the full **Created** timestamp with its time zone, and shows at most 50 rows. Empty, it reads `No tool or integration changes recorded yet. Enabling a tool or connecting an integration will appear here.`; with a search that matches nothing, `No tool matches this search.`
## The Users tab
Three tiles — **Requests**, **Total tokens used** and **Total spend** — each sub-labelled **Across the organization**. They come from the organization's agent-run records rather than from gateway receipts: an MCP tool call consumes no tokens itself, the agent that decided to make it does. They follow the range you selected, but they never narrow to one workspace; for the spend figures themselves, and for what is recorded per model call, see [Usage and spend](/llm-gateway/usage-and-spend).
Below them is one row per actor, ranked by request count, with columns **User**, **Requests**, **Tools used** (distinct tools reached for, not a repeat of the request count), **Failed** and **Last seen**. Before anything has run it reads `No one has used this gateway yet. People and agents appear here once they make a request.`
An actor here is the agent id recorded on the receipt, not a person's account. Every gateway call carries the agent id `mcp-gateway`, whoever made it and from wherever — a background run's own calls included. The other id you may see is `orchestrator`: chat records handing an objective to Factory as the same receipt pair, so it lands on this page beside the gateway's own traffic. Read the column as *which agent*, and use the three tiles for organization totals.
## The Live activity tab
Every individual call in the loaded window, one per row. A **Search tool, connector, or actor…** box matches on the tool name, the actor and the connector; a status filter offers **All statuses**, **Succeeded**, **Failed** and **Running**; and a counter reads ` of calls`.
The columns are **Request**, **Connector**, **Status**, **Duration** and **Actions**. The request cell shows the resolved operation, falling back to the raw tool name, with the actor beneath it and the error text beneath that when the call failed. The connector cell shows an em dash when the tool resolved to no connection. The row menu holds **Created** and the full **Tool** name as the caller invoked it — search matches that name rather than the shortened operation in the cell. Rows are paged 25 at a time, adjustable to 10, 50 or 100.
Status is derived from the receipt pair rather than stored:
* **Succeeded** — a `tool.observed` receipt followed the call.
* **Failed** — the `tool.called` receipt carried an error, which settles the call immediately.
* **Running** — neither: a `tool.called` with no error and no observation yet.
Filtering happens over the window already in memory rather than by refetching, so a narrowed view can never disagree with the totals on the Dashboard tab. With filters applied and nothing matching, the table reads `No requests match these filters.`; with no filters and nothing recorded, `No gateway entries found. Agent activity will appear here as your team makes requests.`
## How the figures are derived
Each gateway call recorded through `/connect/call` writes a `tool.called` receipt and, when it succeeds, a `tool.observed` receipt, into a stream belonging to that workspace — carrying the tool name, the arguments it was called with, the duration and the workspace. The observation carries the first 2,000 characters of the result and marks itself truncated beyond that, so no full payload is copied into a receipt. A failed call gets only the `tool.called`, with its error.
Each load of the page reads up to 5,000 `tool.called` and 5,000 `tool.observed` receipts from the organization's streams and merges them in sequence order, so an observation is always processed after the call it belongs to. The selected window and the one before it come out of that same read, which is why the deltas cost nothing extra.
A call belongs to this workspace when its receipt recorded a matching workspace id. Receipts written before that field existed fall back to connector attribution: the tool name is resolved against this workspace's own valid connections through the `receipt___` and `____` forms, plus the `mcp____` convention MCP clients use. A name that resolves to no connected application cannot be assigned to a workspace, so it is left out of the workspace's figures rather than counted under every workspace.
Nothing is filled in with a placeholder: a metric that cannot be computed from a receipt renders as an em dash. Read the page as a picture of the tool calls that were recorded, not as a complete account of what an agent did — for that, open the run's [replay](/co-worker/replay).
## The workspace Activity page
A separate, smaller page titled **Activity** describes itself as "Connection lifecycle events visible only in the selected workspace." It has no sidebar link; you reach it at the workspace's `…/activity` address, where the breadcrumb reads *Activity*.
It lists that workspace's connections, most recently changed first, each as `provider · name` with `Connection status: ` and the time it last changed. The list is the replicated connection table rather than receipts, so it reflects connecting, reauthorizing and disconnecting an app — an `invalid` status is the signal that a connection needs reconnecting. With no connections it reads `No activity in this workspace yet.`
**The Activity page shows no tool calls, and its own panel says so.** Under **Recent activity** it reads: "Tool request receipts will appear here when gateway execution reporting is available. Connection events below are live now." Until that changes, tool traffic lives on the Gateway activity dashboard above and this page is a connection log.
 Next step: [understand the security model](/mcp-gateway/security-model).